Oscilloscope
Overview
- Purpose: The Oscilloscope is a visualization tool that displays signal waveforms over time, allowing users to observe how digital signals change, analyze timing relationships, and debug circuit behavior.
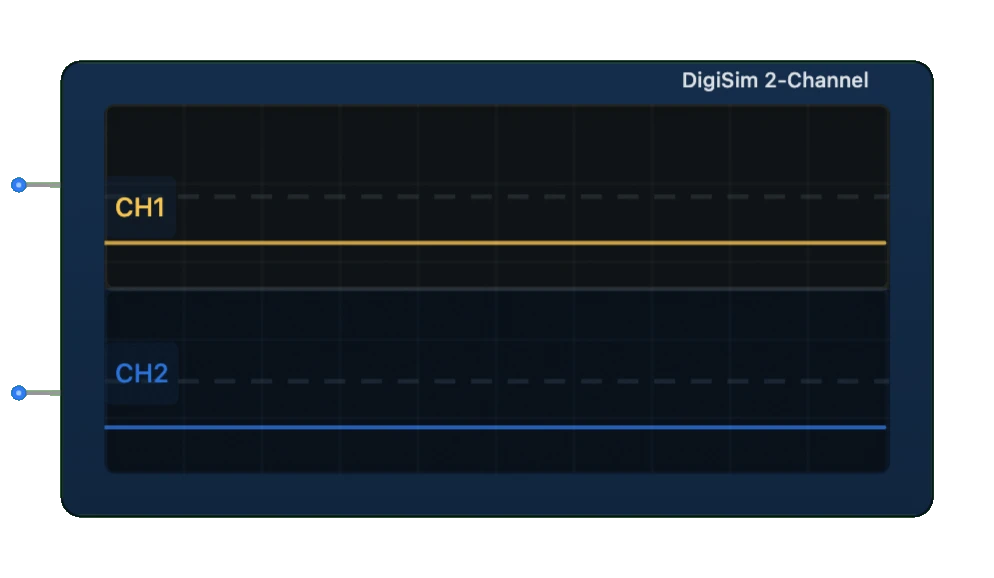
- Symbol: Represented as a rectangular display with a screen showing signal traces and time grid.
- DigiSim.io Role: Serves as an essential diagnostic and educational component in digital circuits, providing real-time visualization of up to two signals simultaneously without affecting circuit operation.
Functional Description
Logic Behavior
The Oscilloscope captures and displays digital signals as waveforms over time. It samples connected signals continuously and plots them on a time-based grid, showing transitions between LOW and HIGH states.
Display Output:
- X-axis: Represents time (adjustable timebase)
- Y-axis: Represents signal value (LOW or HIGH)
- Signal trace: Shows the transitions and states of the input signals
- Grid: Provides timing reference for measurements
Inputs and Outputs
Inputs:
- Channel 1: Primary signal input for waveform visualization.
- Channel 2: Secondary signal input for waveform visualization.
Outputs: None (visualization only).
Configurable Parameters
- Timebase: Controls the time scale (horizontal axis).
- Trigger: Determines when the display starts capturing the waveform.
- Channel Selection: Enables/disables display of specific channels.
- Persistence: Controls how long old signals remain visible.
- Grid: Toggles grid visibility for easier measurement.
- Pause/Resume: Temporarily stops or continues signal capture.
Visual Representation in DigiSim.io
The Oscilloscope appears as a rectangular component with a display screen showing signal waveforms. The screen includes a grid for timing reference and traces that update in real-time as signals change. Control buttons or settings may be visible around the display area.
Educational Value
Key Concepts
- Signal Visualization: Demonstrates how digital signals change over time.
- Timing Analysis: Shows the temporal relationships between signals.
- Edge Detection: Illustrates rising and falling edges in digital signals.
- Pulse Width: Demonstrates the duration of HIGH and LOW states.
- Signal Debugging: Emphasizes the importance of signal monitoring in troubleshooting.
- Sampling: Introduces concepts of signal sampling and display.
Learning Objectives
- Understand how digital signals behave and change over time.
- Learn to analyze timing relationships between different signals.
- Recognize common signal patterns and abnormalities in digital circuits.
- Apply oscilloscope visualization to troubleshoot timing issues.
- Comprehend the concepts of signal edges, pulses, and state durations.
- Develop skills in interpreting waveform displays for digital systems.
Usage Examples/Scenarios
- Clock Analysis: Observing clock signals to verify proper frequency and duty cycle.
- Sequential Logic Debugging: Visualizing flip-flop inputs and outputs to verify correct operation.
- Protocol Analysis: Examining communication protocols like serial data transmission.
- Timing Verification: Checking setup and hold times in critical paths.
- Glitch Detection: Identifying unwanted brief pulses or transitions in signals.
- Edge Timing: Measuring delays between related signals.
- Trigger Events: Using one signal to trigger the capture of another related signal.
Technical Notes
- The oscilloscope samples signals at regular intervals defined by the internal sampling rate.
- Higher sampling rates provide more detailed waveform visualization but require more processing power.
- The timebase setting determines how much time is visible across the display width.
- Trigger functionality helps stabilize the display of repetitive signals.
- The display is non-intrusive and does not affect the circuit being monitored.
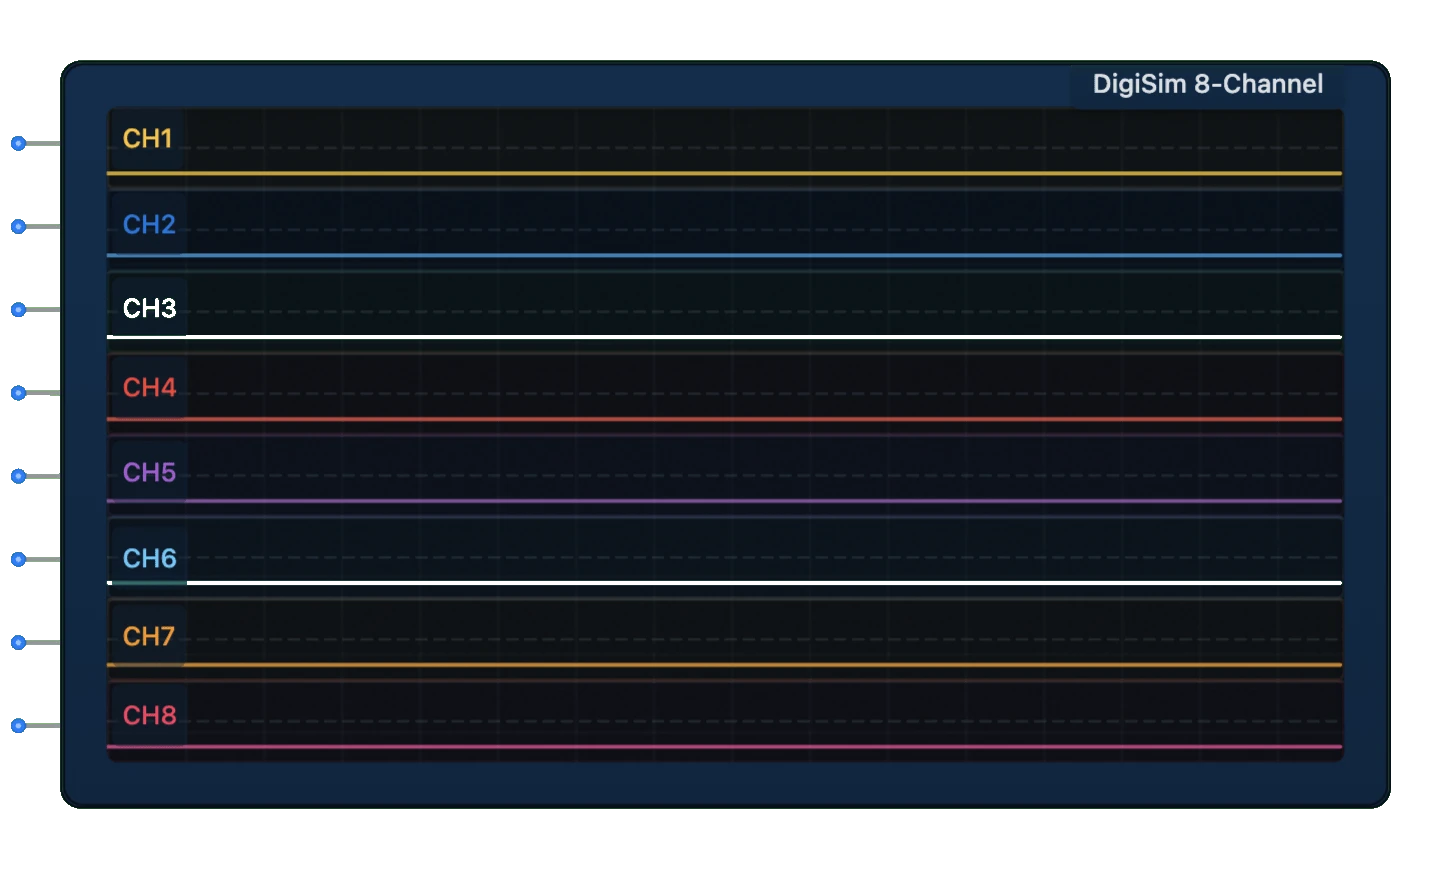
- For more complex signal analysis, the 8-channel oscilloscope variant provides extended capabilities.
- In DigiSim.io, the oscilloscope provides an accurate representation of signal timing, subject to the simulation's time resolution.
Characteristics
- Real-time visualization of digital signals
- Displays signal transitions, pulse width, and timing relationships
- Multiple channel support allows comparison between signals
- Configurable timebase for different frequency ranges
- Helpful for debugging timing issues and signal integrity problems
- Non-intrusive monitoring - doesn't affect the circuit being monitored
- Samples signals at regular intervals defined by the sampling rate
Applications
- Analyzing clock signals and their relationships
- Debugging timing-related issues in sequential circuits
- Visualizing communication protocols (serial, parallel)
- Measuring pulse widths, frequencies, and duty cycles
- Observing signal propagation and transitions
- Verifying proper signal sequence in complex circuits
- Educational tool for understanding digital signal behavior
- Troubleshooting signal integrity issues
Waveform Analysis
The Oscilloscope helps analyze several aspects of digital signals:
- Signal Transitions: Rising and falling edges
- Pulse Width: Duration of HIGH or LOW states
- Timing Relationship: Phase relationship between signals
- Glitches: Unexpected brief pulses or transitions
- Clock Skew: Timing differences between related clock signals
- Setup and Hold Times: Critical timing parameters for sequential circuits
Usage Tips
- Use the timebase control to zoom in/out of the time axis
- For slower signals, increase the timebase to see more periods
- For faster signals, decrease the timebase to see details
- Use the trigger to stabilize repetitive waveforms
- Compare multiple signals to verify timing relationships
- Look for unexpected transitions or glitches that may indicate problems
Related Components
- Logic Analyzer: Multi-channel version of the oscilloscope
- Oscilloscope (8-Channel): Extended version supporting 8 input signals
- Frequency Counter: Measures signal frequency rather than displaying waveforms
- Waveform Generator: Creates test signals for circuit input