8-Channel Oscilloscope
Overview
- Purpose: The 8-Channel Oscilloscope is a multi-channel visualization tool that simultaneously displays waveforms from up to eight digital signals, allowing users to observe signal transitions, analyze timing relationships, and debug complex digital circuits.
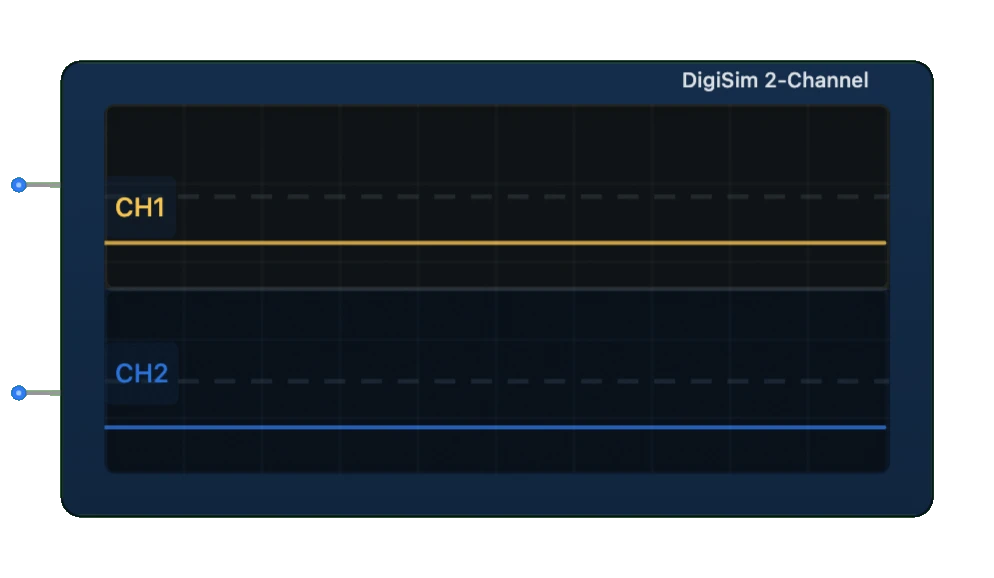
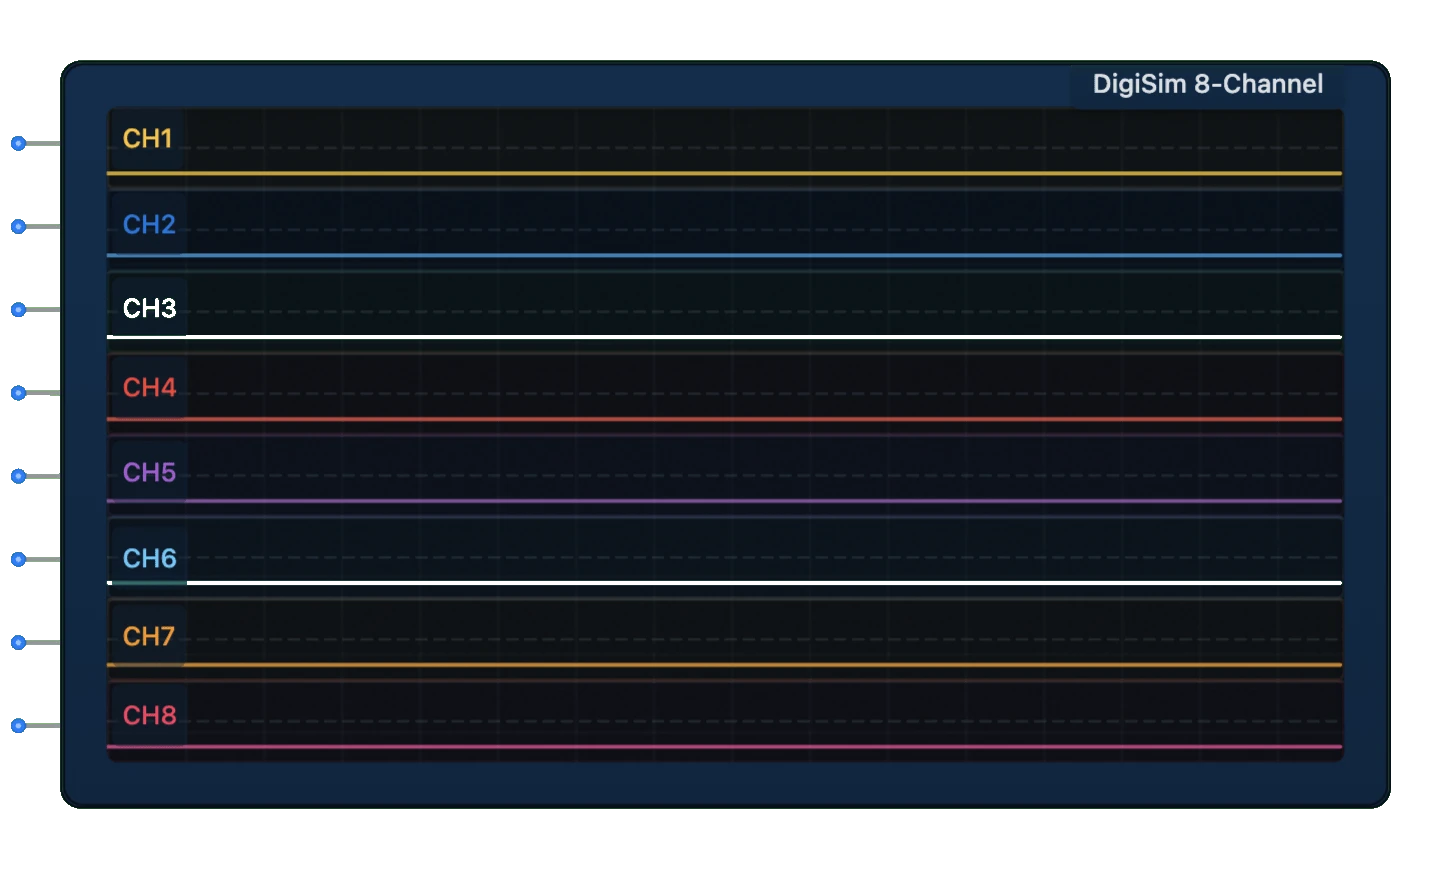
- Symbol: Represented as a rectangular display with eight input channels and a screen showing multiple signal traces on a time-based grid.
- DigiSim.io Role: Serves as an advanced diagnostic and analytical component for monitoring and troubleshooting complex digital circuits with multiple interrelated signals.
Functional Description
Logic Behavior
The 8-Channel Oscilloscope samples and displays the logic states (HIGH/LOW) of eight different signal sources over time. It provides real-time or triggered visualization of signal transitions and timing relationships.
The oscilloscope continuously samples each of its eight input channels and displays the resulting waveforms on a time-based grid. Users can configure various aspects of the display, including time scale, trigger conditions, and channel visibility.
Inputs and Outputs
Inputs:
- CH1 - CH8: Eight independent signal input channels for waveform visualization.
Outputs: None (visualization only).
Configurable Parameters
- Timebase: Controls the time scale (horizontal axis) for all channels.
- Trigger Source: Selects which channel initiates the display capture.
- Trigger Type: Edge (rising, falling, or both) or pattern-based triggering.
- Trigger Mode: Normal, auto, or single capture.
- Channel Display: Individual enable/disable for each channel.
- Display Style: Digital (step) or analog-style interpolation.
- Persistence: Controls how long old signals remain visible.
- Grid: Toggles grid visibility for easier measurement.
- Cursors: Measurement tools for timing analysis.
- Channel Labels: Custom text identifiers for each channel.
Visual Representation in DigiSim.io
The 8-Channel Oscilloscope appears as a rectangular component with a large display area showing up to eight waveforms in different colors. The display includes a time grid for reference, and the component has input pins for each channel on one side. Control buttons and settings may be visible around the display area for adjusting view parameters.
Educational Value
Key Concepts
- Multi-channel Signal Analysis: Demonstrates relationships between multiple signals in a digital system.
- Protocol Visualization: Shows how digital communication protocols appear as signal patterns.
- Timing Relationships: Illustrates clock-to-data timing, setup and hold times, and propagation delays.
- Synchronization: Demonstrates how signals coordinate in sequential circuits.
- Debugging Techniques: Teaches methodical approaches to tracking down timing issues.
- Signal Integrity: Reveals glitches, metastability, and other signal anomalies.
Learning Objectives
- Understand how multiple signals interact in complex digital systems.
- Learn to analyze timing relationships between related signals.
- Recognize common digital protocols and their waveform patterns.
- Apply oscilloscope techniques to debugging sequential and combinational circuits.
- Comprehend clock domain relationships and synchronization issues.
- Develop skills in using triggers and cursors for precise timing analysis.
- Master the interpretation of multi-signal waveforms for system understanding.
Usage Examples/Scenarios
- Bus Protocol Analysis: Observing address, data, and control signals during bus transactions.
- State Machine Debugging: Visualizing control signals and state transitions in sequential circuits.
- Microprocessor Signal Timing: Analyzing clock, address, data, and control signals in a processor circuit.
- Communication Protocol Verification: Examining serial communication signals (SPI, I2C, UART) across multiple lines.
- Memory Interface Analysis: Observing address, data, and control signals during memory read/write operations.
- Clock Distribution Verification: Checking for clock skew across multiple clock lines.
- Interrupt Handling Analysis: Monitoring interrupt request and acknowledge signal sequences.
- Pipeline Stage Monitoring: Visualizing data flow through multiple pipeline stages.
Technical Notes
- The 8-Channel Oscilloscope samples signals at regular intervals defined by the internal sampling rate.
- Higher sampling rates provide more detailed waveform visualization but require more processing power.
- The buffer depth (history length) determines how much signal history can be viewed.
- Trigger functionality helps stabilize the display of repetitive signals or capture specific events.
- Edge triggering activates on signal transitions, while pattern triggering responds to specific combinations.
- The display is non-intrusive and does not affect the circuit being monitored.
- Cursor measurements enable precise timing analysis between events on different channels.
- In DigiSim.io, the 8-Channel Oscilloscope provides an accurate representation of signal timing relationships, subject to the simulation's time resolution.
Features and Functionality
Multi-Channel Monitoring:
- Eight independent input channels (CH1-CH8)
- Each channel can be individually enabled or disabled
- Color-coded waveforms for easy identification
- Customizable channel labels
Display Configuration:
- Adjustable time base (horizontal scaling)
- Vertical scaling options
- Scrollable view for examining signal history
- Grid overlay for timing measurements
Trigger Capabilities:
- Edge triggering (rising, falling, or both)
- Pattern triggering across multiple channels
- Pre-trigger and post-trigger buffer viewing
- Trigger position adjustment
Measurement Tools:
- Cursor measurements for timing and level analysis
- Automatic measurements (frequency, duty cycle, pulse width)
- Time interval measurement between events
- Waveform statistics
Visualization Options:
- Digital (step) mode for binary signals
- Analog-style interpolation for smoother viewing
- Persistence display for detecting intermittent issues
- Bus display mode for grouped signals
Data Management:
- Waveform storage and recall
- Waveform comparison (overlay)
- Export capabilities for documentation
- Annotation features
Operating Parameters
Time Base Range:
- Adjustable from nanoseconds to seconds per division
- Zoom functionality for detailed examination
Sample Rate:
- Fixed or adaptive based on simulation speed
- Configurable sample rate for optimal signal capture
Buffer Depth:
- Waveform history retention (configurable)
- Typically 1,000 to 10,000 samples per channel
Trigger Modes:
- Normal: Waits for trigger event to update display
- Auto: Updates periodically even without trigger
- Single: Captures one triggered sequence then stops
Display Size:
- Adjustable window dimensions
- Configurable grid divisions
Implementation Details
Signal Acquisition
- Samples digital input signals at regular intervals
- Stores sample history in a circular buffer
- Timestamps each sample for accurate timing display
Trigger Processing
- Continuously monitors inputs for trigger conditions
- Positions the display window relative to trigger point
- Provides stable waveform visualization
Display Rendering
- Scales time and amplitude values to screen coordinates
- Renders waveforms using appropriate drawing style
- Updates in real-time during simulation
Measurement Engine
- Analyzes captured data for automated measurements
- Calculates statistics on signal properties
- Provides cursor-based manual measurements
Applications
Digital Circuit Design and Verification
- Monitoring signal transitions in combinational circuits
- Verifying timing relationships in sequential circuits
- Debugging race conditions and glitches
Protocol Analysis
- Examining serial communication protocols (SPI, I2C, UART)
- Verifying bus cycles in parallel interfaces
- Analyzing handshaking sequences
Timing Verification
- Measuring propagation delays
- Verifying clock distribution
- Analyzing setup and hold time relationships
State Machine Debugging
- Visualizing state transitions
- Verifying control sequences
- Identifying incorrect state behavior
Clock Domain Analysis
- Observing multiple clock domains
- Detecting clock synchronization issues
- Visualizing clock-to-data relationships
Educational Applications
- Teaching digital logic fundamentals
- Demonstrating circuit behavior visually
- Exploring timing concepts
Design Documentation
- Capturing waveforms for technical documentation
- Creating timing diagrams for specifications
- Providing visual evidence of correct operation
Interface Controls
Primary Controls
- Run/Stop Button: Toggles continuous acquisition
- Single Capture Button: Performs one acquisition cycle
- Time Base Control: Adjusts horizontal time scale
- Trigger Controls:
- Source selection (which channel triggers acquisition)
- Trigger type (edge, pattern)
- Trigger level
- Trigger slope (rising/falling)
- Channel Controls:
- Channel enable/disable toggles
- Channel position (vertical offset)
- Channel labels
Secondary Controls
- Cursor Controls:
- Time cursors for duration measurements
- Voltage cursors for level measurements
- Measurement Selection:
- Frequency measurement
- Pulse width measurement
- Duty cycle calculation
- Edge counting
- Display Options:
- Grid visibility
- Persistence settings
- Waveform style (step/linear)
- Color scheme
Usage Guidelines
Setting Up Channels
- Connect signals of interest to input channels
- Enable relevant channels in the oscilloscope interface
- Adjust vertical position for optimal viewing
Configuring Timebase
- Set appropriate time per division to view signals
- Adjust horizontal position to focus on region of interest
- Use zoom features for detailed analysis
Configuring Triggers
- Select trigger source channel
- Set trigger type and condition
- Adjust trigger level if needed
- Select appropriate trigger mode
Taking Measurements
- Use cursors for manual measurements
- Enable automatic measurements for key parameters
- Save or export results as needed
Advanced Analysis
- Compare signals across multiple channels
- Look for timing violations or unexpected transitions
- Use persistence to detect intermittent issues
Limitations
Resource Usage
- High sample rates and buffer depths require substantial memory
- Real-time rendering may impact simulation performance
Signal Fidelity
- Only binary logic levels are captured (not analog characteristics)
- Timing resolution limited by sampling frequency
- May miss very short pulses between sample points
Trigger Limitations
- Complex trigger conditions may be limited
- Pre-trigger buffer size constraints
- Delay between trigger and display update
Measurement Precision
- Timing measurements limited by sample rate
- Statistical measurements require sufficient samples
- Cursor resolution dependent on zoom level
Related Components
- Single-Channel Oscilloscope: Simplified version with one input channel
- Logic Analyzer: Similar functionality with focus on multi-channel digital signals
- Waveform Generator: Companion component that generates test signals
- Protocol Analyzer: Specialized tool for decoding communication protocols
- Counter/Timer: Component for measuring frequency and timing characteristics
- Data Logger: Records signal values over extended periods
- Pattern Generator: Creates predefined test patterns for circuit stimulation
- Bus Monitor: Displays activity on data and address buses